Section5.1Plotting Vector Valued Functions of One Variable
Objectives
To understand how the plot of a vector valued function of one variable corresponds relates to the function.
To understand how the position vector is defined for a vector valued function of one variable.
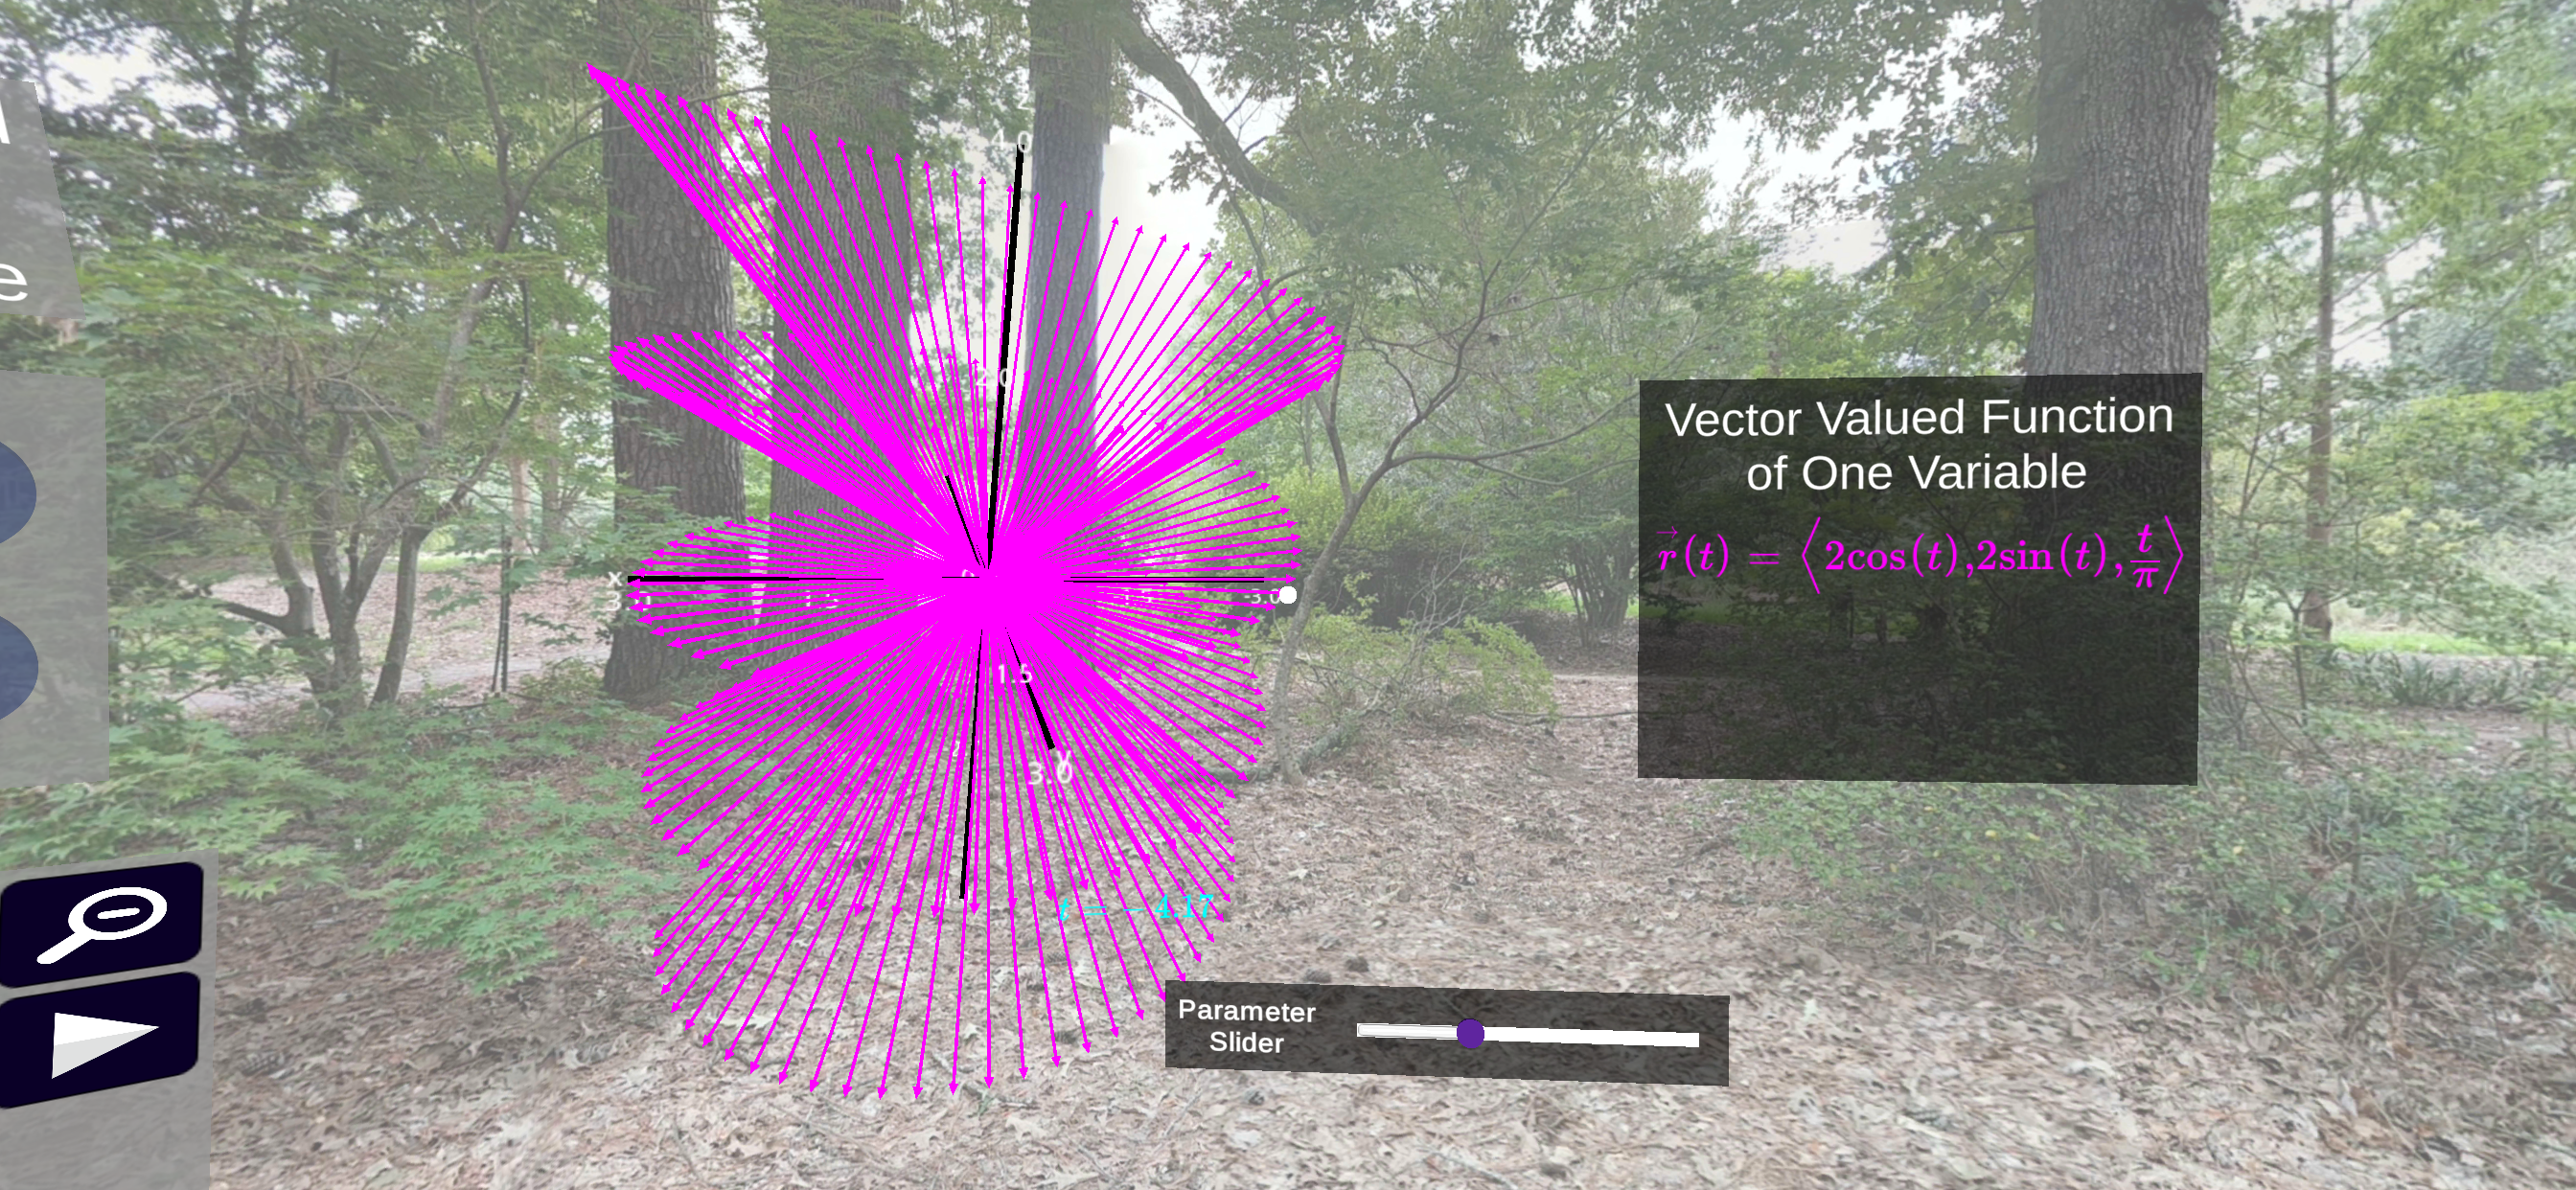
Figure5.1.1.A screenshot from the lesson on cylindrical coordinates in three dimensions
In this lesson, the user explores the correspondence between vector valued functions of one variable and curves in space. In particular, the vector output of the vector valued function is plotted and the user can see how the vectors plotted in standard position will trace out a path in space. The definition and concept of the position vector are presented. A followup question asks the user to examine a new curve and select which of the plotted vectors corresponds to the position vector.
Subsection5.1.1Non-Uniqueness of Parameterizations
Activity5.1.1.Circle Parameterizations.
We will be looking how various changes to vector valued functions of one variable affect the graph of the curve in space. For this activity we will be using very simple curves in two dimensions but the same conclusions can be made for curves in three dimensions. Take a minute to familiarize yourself with the Desmos interactive in Figure 5.1.2.
Figure5.1.2.A Desmos interactive for a plotting two-dimensional vector-valued function
(a)
Change \(f\) and \(g\) to \(\cos(2t)\) and \(\sin(2t)\text{.}\) Make sure you click the play button next to the definition of \(s\) to examine how the vector valued function moves along the curve. Describe how the graph of \(\langle\cos(2t),\sin(2t)\rangle\) is different than \(\langle\cos(t),\sin(t)\rangle\text{.}\) You should pay attention to how the curve is different and how the functions describe movement along the curve.
Hint.
Think about what value of \(t\) for this vector valued function would give the same output as in in the base case of \(\langle\cos(t),\sin(t)\rangle\text{.}\)
(b)
Change \(f\) and \(g\) to \(2\cos(t)\) and \(2\sin(t)\text{.}\) Make sure you click the play button next to the definition of \(s\) to examine how the vector valued function moves along the curve. Describe how the graph of \(\langle2\cos(t),2\sin(t)\rangle\) is different than \(\langle\cos(t),\sin(t)\rangle\text{.}\) You should pay attention to how the curve is different and how the functions describe movement along the curve.
(c)
Change \(f\) and \(g\) to \(\cos(\sin(t))\) and \(\sin(\sin(t))\text{.}\) Make sure you click the play button next to the definition of \(s\) to examine how the vector valued function moves along the curve. Describe how the graph of \(\langle\cos(\sin(t)),\sin(\sin(t))\rangle\) is different than \(\langle\cos(t),\sin(t)\rangle\text{.}\) You should pay attention to how the curve is different and how the functions describe movement along the curve.
Hint.
Think about what the possible output values of \(\sin(t)\) are and how that would affect the possible outputs of \(\langle\cos(\sin(t)),\sin(\sin(t))\rangle\text{.}\)
Activity5.1.2.Paths on Surfaces in Space.
We will be looking how various vector valued functions of one variable satisfy different geometric or algebraic relationships.
(a)
Verify that the line traced by \(\langle{t-2,-2t+1,3t-1}\rangle\) will be on the plane given by \(-x+y+z=2\text{.}\)
Hint.
Plug in the component functions into the equation for the plane and show that the plane equation is satisfied for every \(t\text{.}\)
(b)
Verify that the line traced by \(\langle{4t+2,-t-3,t+1}\rangle\) will NOT be on the plane given by \(-x+y+z=2\text{.}\)
(c)
For each of the five vector valued functions of one variable given below, check to see if the plot will be on the following surfaces: