To determine how to plot the graphs of inequalities
To learn how to express two dimensional regions using inequalities.
Understand how to combine inequalities to represent various regions.
Subsection1.4.1Inequalities for Function
From your studies in algebra and/or precalculus, you have learned how to graph many different types of functions. For example, you have probably studied graphs such as these
\begin{equation}
y = x^2-4x+4 \qquad y = 2\sin(3x)+1 \qquad y = 2\ln(x) \qquad y = e^{2x}-1,\tag{1.4.1}
\end{equation}
among others.
the corresponding graphs. Spend some time by turning on only one graph at a time and notice that each graph cuts the Cartesian plane in two separate pieces.
Figure1.4.1.The Desmos Interactive for examining the graphs from (1.4.1)
These graphs and many of the graphs we study in calculus are continuous (i.e. can be drawn without lifting a pencil). In situations where we have a continuous function \(y=f(x)\) dividing the plane into two regions, these two regions can be expressed by the inequalities
\begin{equation*}
y > f(x) \qquad \text{and} \qquad y < f(x).
\end{equation*}
Activity1.4.1.
(a)
Use the following tool to see which part is represented by \(>\) and which is represented by \(<\) for each function. Write a few sentences about what patterns you notice about the relationships for etiher \(>\) or \(<\text{.}\)
(b)
Briefly explain why regions corresponding to \(>\) are always "above" the graph of \(y=f(x)\text{.}\)
Subsection1.4.2Implicit Equations and Inequalities
A similar situation occurs with implicit equations. Consider the implicit equation given by
\begin{equation*}
x^3-4xy-y^3 =1.
\end{equation*}
Examining the graph below, we see graph of the equation and corresponding inequalities work in a similar fashion. That is, the green line represents equality. Activate and deactivate the pieces corresponding to the inequalities on the Desmos Interactive below.
Question1.4.2.
Which part corresponds to \(>\) and which to \(<\text{?}\)
This might seem counterintuitive because the part at the “top” (or “above the curve”) corresponds to \(<\) and the part at the “bottom” (or “below the curve”) corresponds to \(>\text{.}\) So, how does one tell which part is which?
It turns out the idea behind the Intermediate Value Theorem applies. That is, \(x^3-4xy-y^3\) cannot go from being \(>1 \) to \(< 1 \)unless we cross the green line where \(x^3-4xy-y^3=1\text{.}\) This is important because it allows us to check one point and make a determination.
Consider the red region below. Clearly the point \((0,0)\) is in this region. Let’s plug this point in to our equation
\begin{equation*}
x^3-4xy-y^3 =1.
\end{equation*}
We get \(0=1\text{.}\) This seems bad, but it is expected. The point is not on the graph, so the equation should not evaluate to something true. However, since \(0 < 1\) this tells us that \((0,0)\) is in the region where
\begin{equation*}
x^3-4xy-y^3 < 1
\end{equation*}
and, consequently, the entire region corresponds to the inequality above. A little logical deduction will tell you that the region that is not highlighted must corresponding to
Let us now consider some examples of the relationship between regions and inequalities.
Example1.4.3.
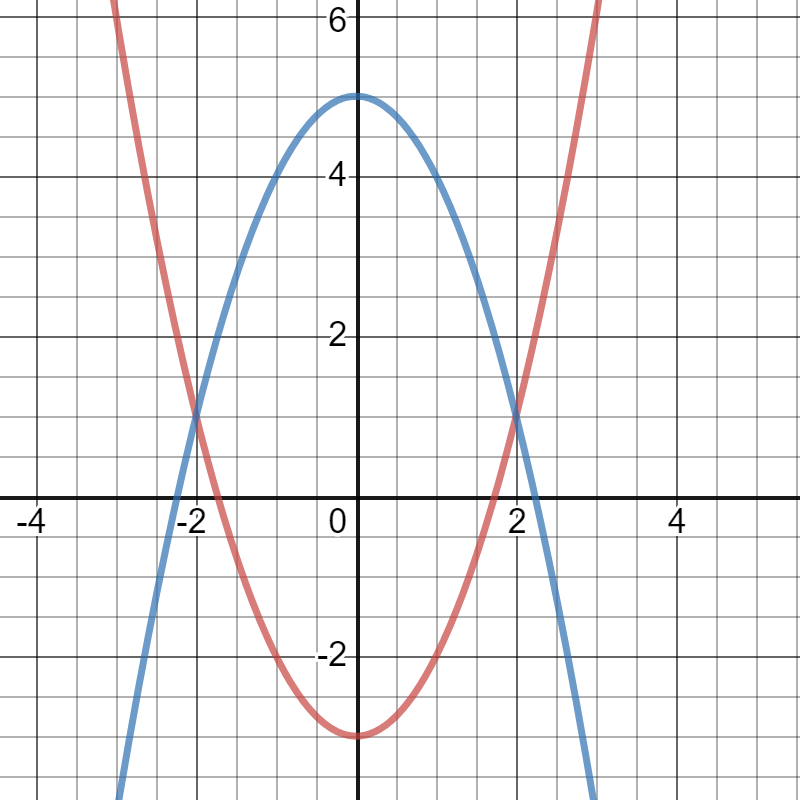
Suppose we want to specify the region given inside the parabolas
\begin{equation*}
y = x^2-3 \qquad \text{and} \qquad y=-x^2+5
\end{equation*}
We can start by graphing the two parabolas.
We notice \((0,0)\) is inside the region we desire. (Pro tip: Always use \((0,0)\text{,}\) when possible, for a check.) So, substituting into the equations we get the false statements
Thus, because 0 is in fact larger than \(-2\text{,}\) the first statement tells us we need to specify that \(y > x^2-3\) and, likewise, the second statement tells us that \(y < -x^2+5 \text{.}\) We can express this in one equation via
\begin{equation*}
x^2-3 < y < -x^2+5.
\end{equation*}
To be more specific we should give bounds on \(x\text{.}\) From the graph it appears possible that \(x\) stays between \(2\) and \(-2\text{.}\)
Let’s verify this algebraically. Setting the equations together we obtain
Thus to specify the region we indeed should have \(-2 < x < 2\text{.}\) Hence the region inside the parabolas is more appropriately given by the inequalities
\begin{equation*}
x^2-3 < y < -x^2+5 \qquad \text{and} \qquad -2 < x < 2 \text{.}
\end{equation*}
Example1.4.4.
Let’s do the opposite of what we did in the previous example. Suppose we are given inequalities:
\begin{equation*}
y \leq x \leq 2y \qquad \text{and} \qquad 1 \leq y \leq 2.
\end{equation*}
We will try to represent this region. Start with the simpler inequality \(1 \leq y \leq 2\text{.}\) Well, \(y=1\) and \(y=2\) are horizontal lines, so this puts us in the band represented in the image below.
(Notice our favorite check point \((0,0)\) is outside the region and likewise \(1 \leq 0 \leq 2 \) is false.) Now let’s add the constraint of \(y \leq x \leq 2y \text{.}\) This inside really two inequalities
\begin{equation*}
x \leq 2y \qquad \text{and} \qquad y \leq x.
\end{equation*}
We begin by graphing the line \(y=x\text{.}\) Note that our favorite check point \((0,0)\) is on the line. So, we must pick something else....how about \((1,0)\text{?}\) Subtituting this into the inequality \(y \leq x\) we get \(0 \leq 1\text{,}\) which is true. Thus our region contains the point \((1,0)\) and hence must be below the line.
Repeating this process for \(x \leq 2y\) we get \(1 \leq 0\text{,}\) which is false. This tells use this inequality specifies the region not containing \((1,0)\text{,}\) which is is the region above the line.
Thus the region specified by
\begin{equation*}
y \leq x \leq 2y \qquad \text{and} \qquad 1 \leq y \leq 2.
\end{equation*}
is precisely where all the pretty colors intersect.
Exercises1.4.3Exercises
For the following, define inequalities
\begin{equation*}
\text{___} \leq x \leq \text{___} \qquad \text{___} \leq y \leq \text{___}
\end{equation*}
that specify the following regions. Use the tool below to confirm your results. Please note that you must explicitly type the the ’*’ symbol. For example, \(2x\) is not allowed. You must type 2*x.
1.
2.
3.
4.
For the following inequalities, draw the corresponding region. Afterwards, use the tool above to check your answer.
\(\displaystyle x+1 \leq y \leq 2x+3 \qquad \text{and} \qquad -2 \leq x \leq 1 \)
\(\displaystyle \frac{1}{y} \leq x \leq \sqrt{y} \qquad \text{and} \qquad 1 \leq y \leq 4 \)
\(\displaystyle 2x+1 \leq y \leq -2x^2+5 \qquad \text{and} \qquad -1 \leq x \leq 1 \)