Explain how absolute extrema can occur on the boundary of region.
Look at the connection between contours and the extrema on a boundary.
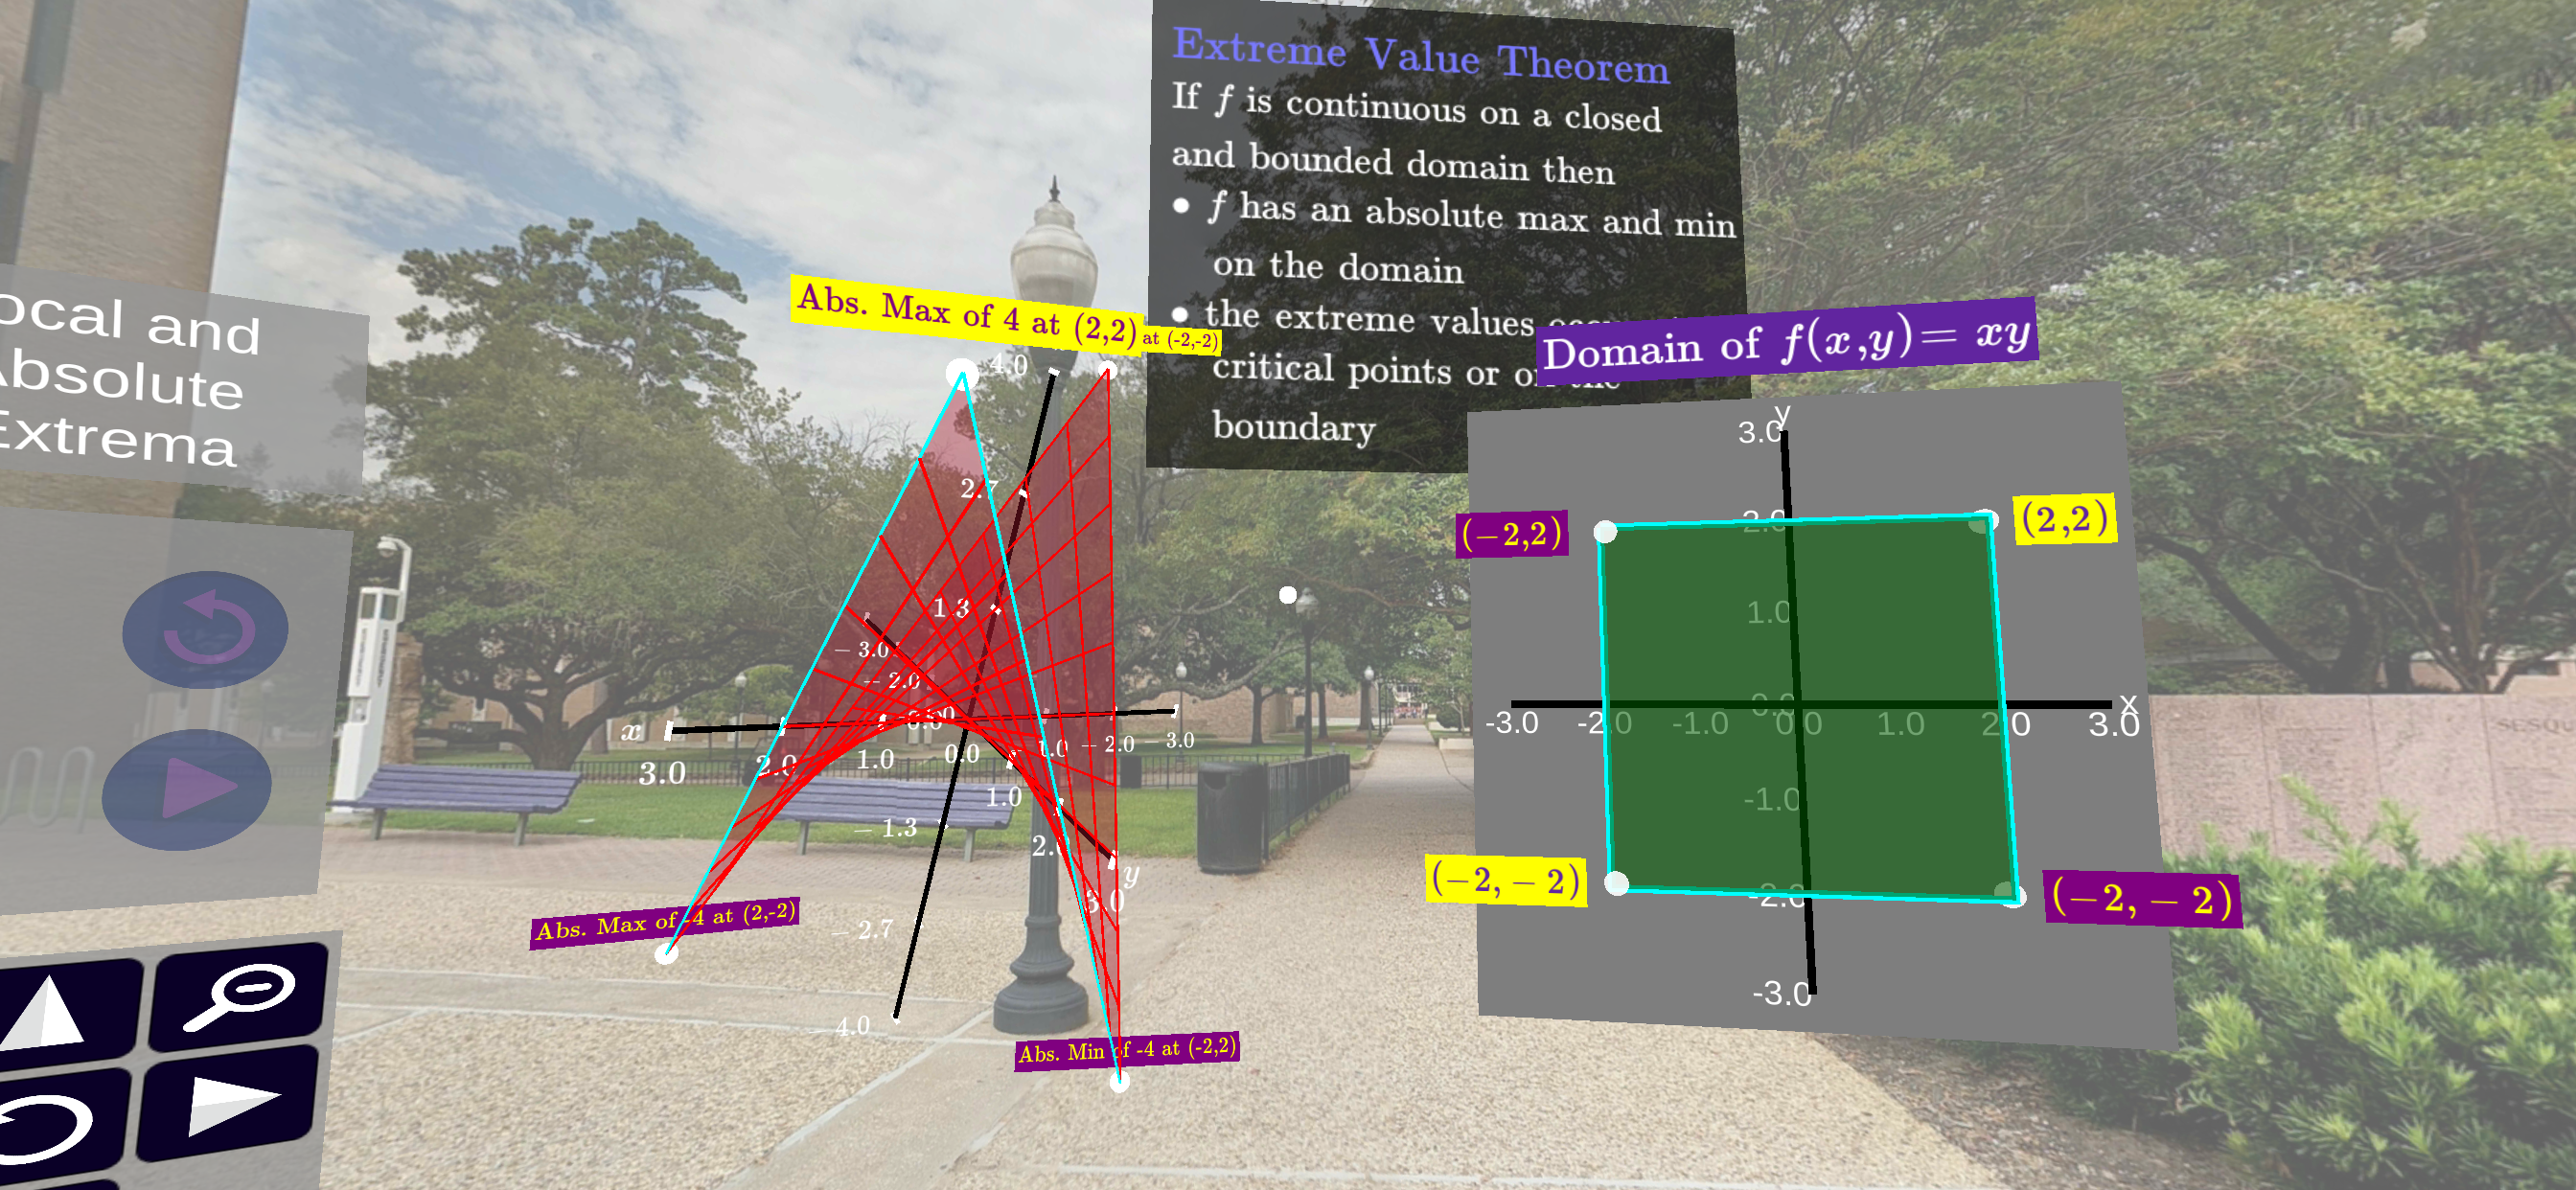
Figure6.11.1.A screenshot from the lesson on absolute extrema of multivariable functions.
This lesson extends on the ideas in the extrema of multivariable functions lesson. Specifically, this lesson looks at how to find absolute extrema on a given region of inputs for a multivariable function. This translates geometrically to finding the highest and lowest points on given section of a surface. In particular, the examples in this lesson show how the absolute extrema on a compact region occur either as a relative extrema or on the boundary of the region. Often looking for extrema on the boundary of a region reduces to an optimization problem from single variable calculus.
Subsection6.11.1Contour Plots and Extrema on the Boundary of a Region
When attempting to find absolute extrema on the boundary of a region, many instances reduce to a simple substitution and proceeding as one would with a typical single variable calculus problem. However, there are times when this is difficult or simply does not work at all. In these cases other techniques prove useful. One way to accomplish this is through the use of contour plots. Consider the problem of finding the absolute extrema of
\begin{equation*}
f(x,y) =x y
\end{equation*}
on the boundary of the region
\begin{equation*}
4x^2+9y^2=32
\end{equation*}
The contour plot of \(f\) is shown here along with the curve \(4x^2+9y^2=32\) in red.
Activity6.11.1.
(a)
Based on the contour plot, what is the maximum of \(f\) on the boundary of the region.
Hint.
Examine the labels where the contours intersect the curve. What is the largest value?
(b)
Find the \((x,y)\) point where the maximum occurs.
Hint.
Using your value from the previous question, set \(f\) equal to this value and solve simultaneously with the boundary equation.
(c)
Using the point from the previous question, find the gradient of \(f\) at the point. Add the vector to the plot above.
(d)
Using the same point as before, find the gradient for the boundary at the point. Add the vector to the plot above.
Hint.
Let \(g(x,y)= 4x^2+9y^2-35\) and proceed as you did for the previous exercise.
(e)
What do you notice about the two gradient vectors that you added to the plot?
(f)
Explain how you can use this information about gradient vectors to find the maximum of a function on the boundary of a regions.