To reinforce the measurement of coordinates and how coordinates can be used to give the equation of a graph
To further familiarize the user with different abilities in the CalcVR app
This lesson begins with an example that leads the user to look at how changing coordinates can move a point along a surface or move the point off of the surface. This introduces the idea of creating equations in \(x\text{,}\)\(y\text{,}\) and \(z\) that can be used to test whether a point is on a surface. This is further explored by looking at what types of graphs corresponds to other plots and describing the coordinate planes with an equation.
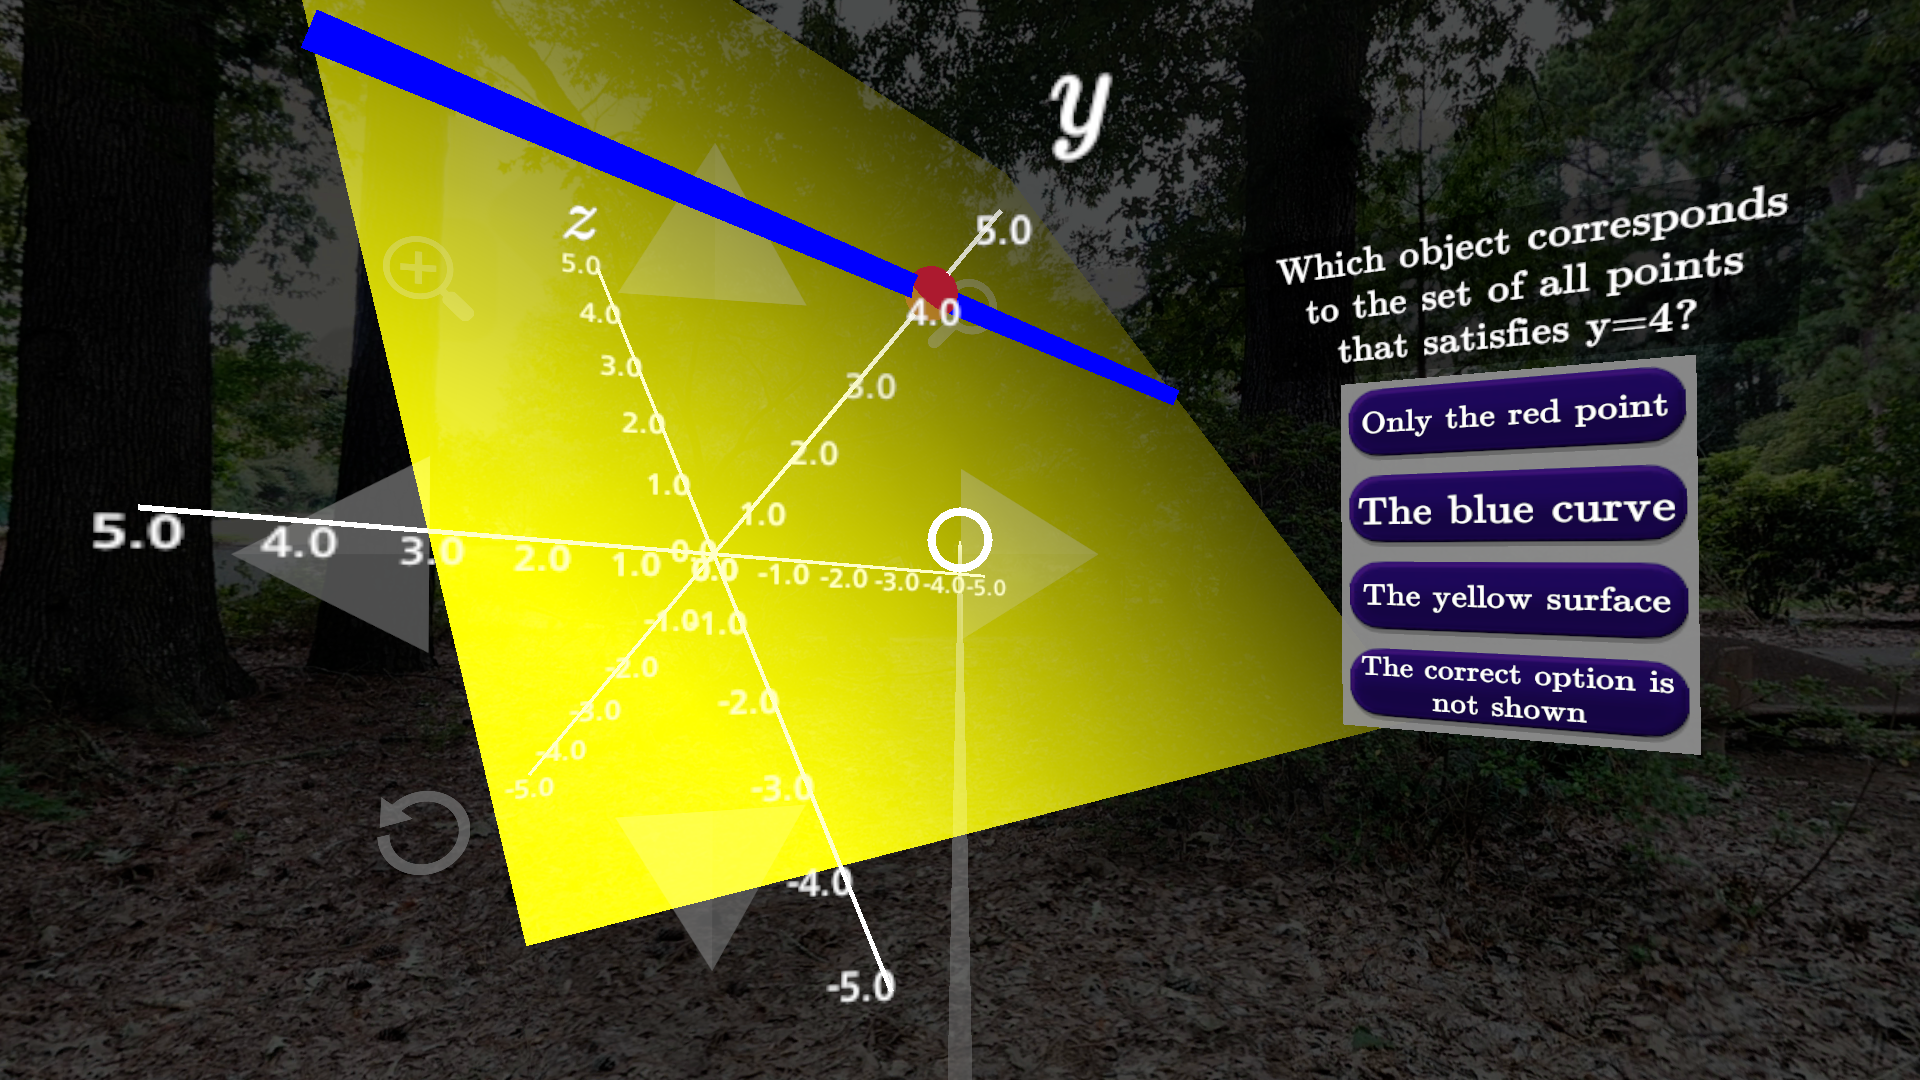
Figure3.1.1.A screenshot from the lesson on Coordinates and Graphs in 3D
Activity3.1.1.Drawing Constant Coordinate Planes.
(a)
Draw all points in three-dimensional space that satisfy:
\(\displaystyle z=1\)
\(\displaystyle x=3\)
\(\displaystyle y=-1\)
(b)
For each one of the coordinate planes given, you should draw a graph of the plane and give an equation. You should also write a sentence to describe how your equation determines whether a point is on the yz-plane (or xz-plane).
the \(yz\)-plane
the \(xz\)-plane
Subsection3.1.1Comments to Instructors
The lesson on Coordinates and Graphs in 3D introduces several functionalities in the CalcVR app, including the ability to toggle coordinates of points by clicking on them, use of sliders to dynamically change graphs, and selecting a point with a given characteristic (to answer an in-lesson question.)