Section 6.12 Multivariable Function and Contour Playground
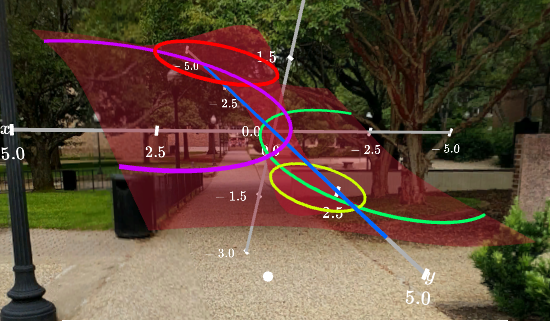
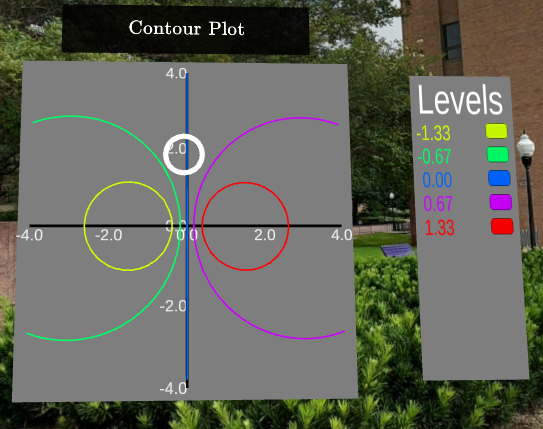
Here we examine the functionality of the Contour Plot Playground. This exploratory playground can be used by students to study the contours and gradients of multivariable functions and parametric surfaces. The user is able to specify the surface of their choice. Once the surface is graphed level curves are displayed along the curve and the corresponding two dimensional contour plot is displayed.
Here is a list of functionality
Subsection 6.12.1 Entering Functions and Parametric Equations
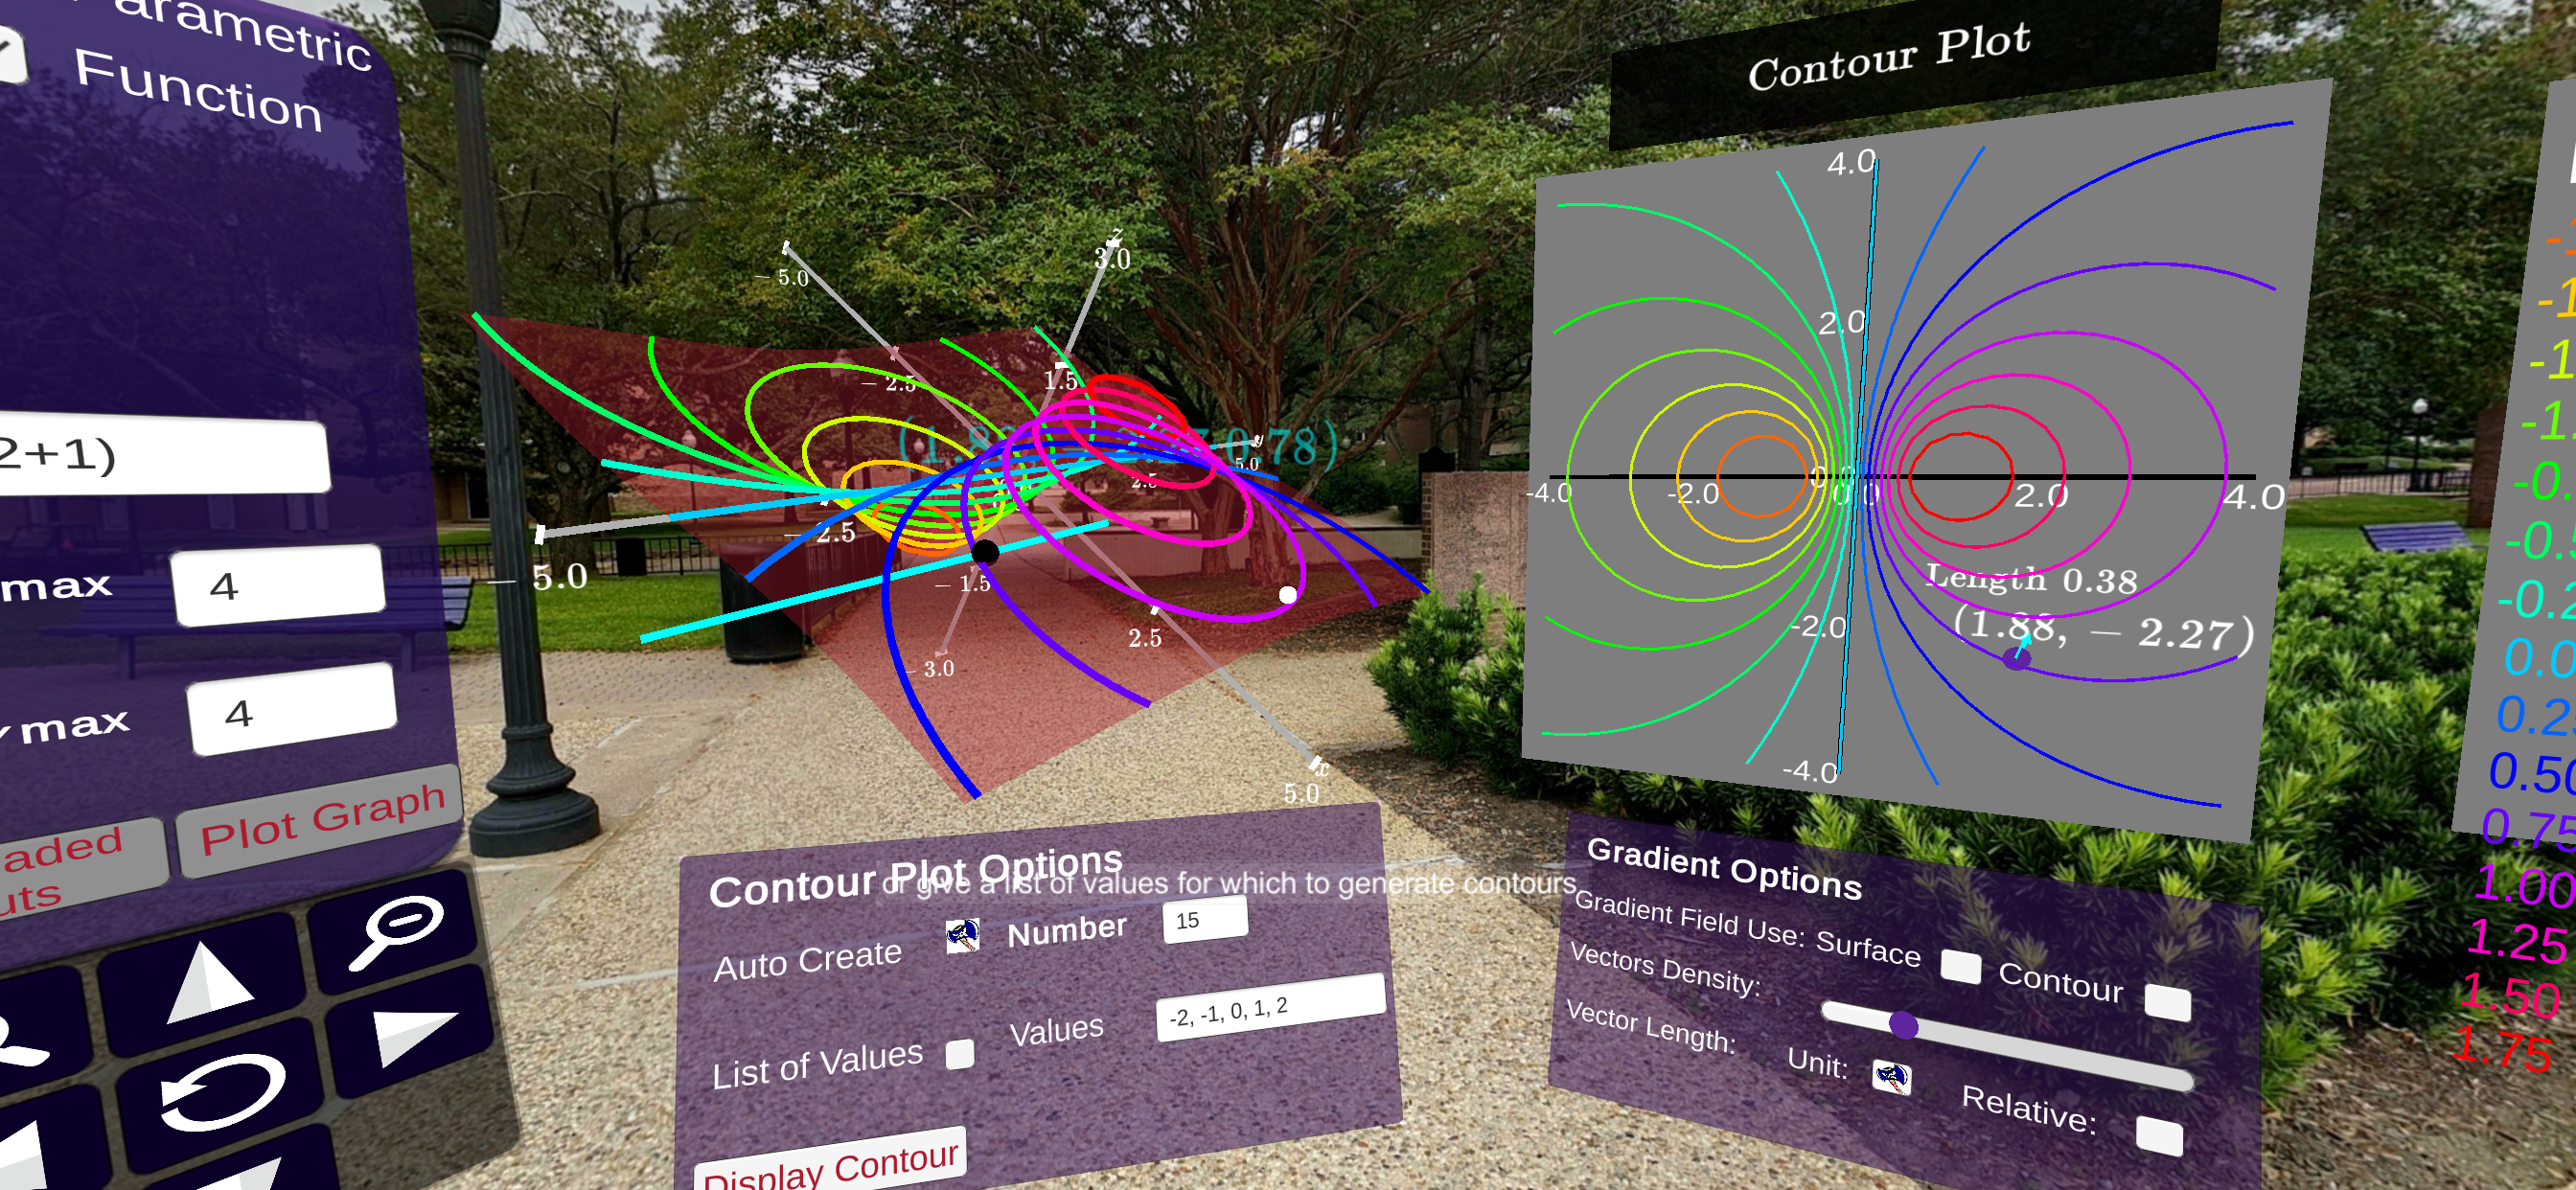
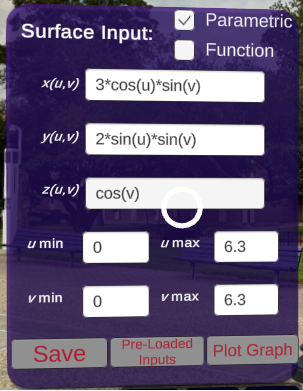
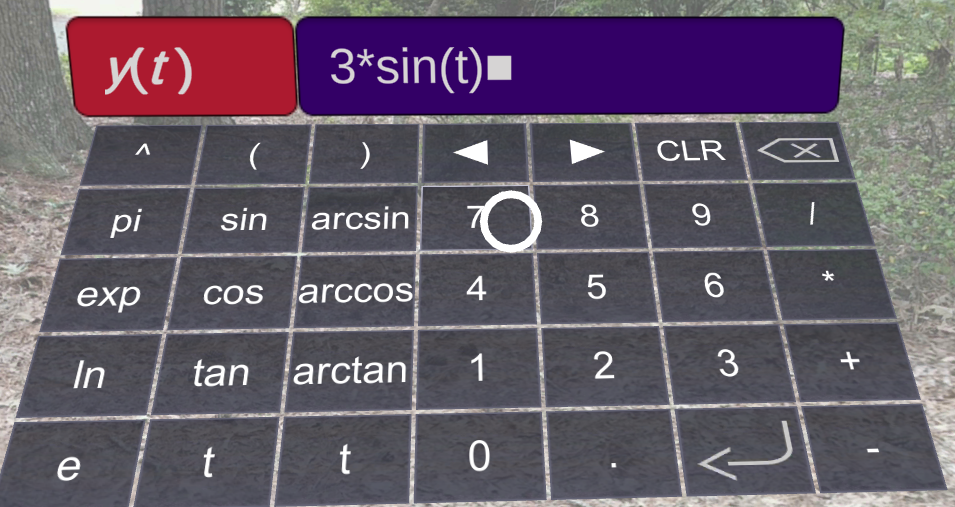
The panel to the left is used to enter equations for the surface. These can be in the form of multivariable function \(z=f(x,y)\) or parametric equations of the form \(G(u,v) = (x(u,v), y(u,v), z(u,v))\text{.}\) When you “click” or “select” one of the textboxes, a keyboard is displayed. This keyboard can be used to enter the equation of your choice. Once you select Enter on the keyboard, the textbox is filled with expression you entered. On the panel clicking or selecting Plot Graph constructs the surface.
Subsection 6.12.2 Loading and Saving Parametric Equations/Functions
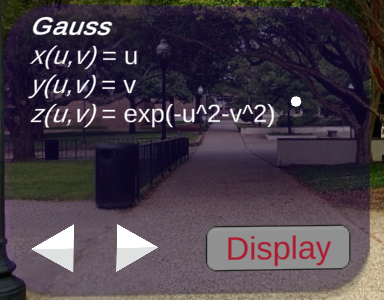
For any set of equations for the surface, the equations can be saved for later viewing. This is accomplished by selecting Save button on the panel pictured below. You can load the equations you saved (and some equations that are pre-saved) by using the Pre-Loaded Inputs button. Use the arrows to select the equations of choice and click on Display to show the parametric surface described by the equations.

Subsection 6.12.3 Displaying Contours
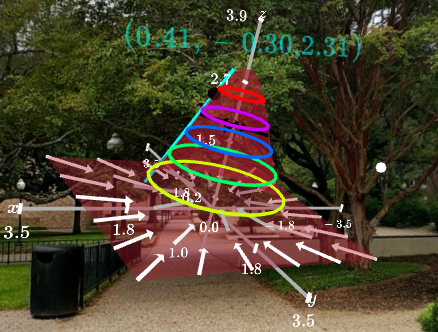
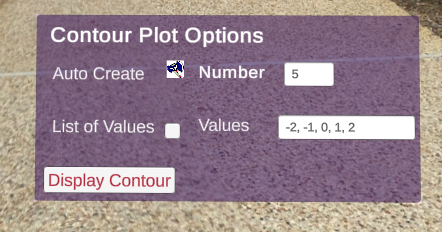
For the displayed surface, the Contour Panel can be used to draw a two dimensional contour plot. The corresponding level curves are also added to the surface. The levels for the curves can be auto generated are specified by the user using the panel.
Subsection 6.12.4 Gradients
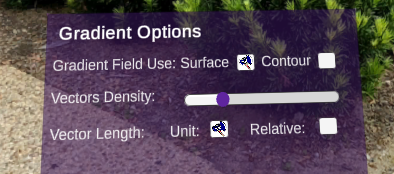
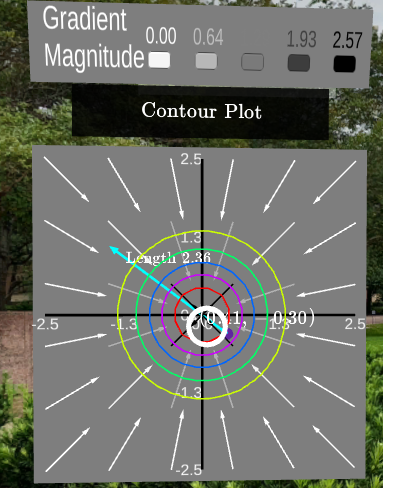
After the contour plot is displayed the user has the option of adding gradient data to both the contour plot and the surface. The gradient panel displayed towards the bottom of the contour plot can be used to add the gradient vectors. The user can select to add them based on the contour plot or the current surface. The vectors are displayed with as the same length for visibility. To distinguish between the actual lengths of the vectors a helpful grayscale legend is displayed about the contour plot. The user can also “Click” on the contour plot to add gradient vectors at a specific location.
