Section 5.12 Vector Valued Function Playground
Here we examine the functionality of the Vector Valued Function Playground. This playground can be used by students to study a parametric curve or vector valued function in three dimensional space.This is a lot of functionality. The user is able to specify the curve of their choice. Once the curve is graphed, vectors describing various aspect of the parametric curve will be drawn. In addition, the user has the option of adding an osculating circle to aid in studying the curvature of the graph. The vectors and osculating circle can be displayed at any location on the curve by moving the slider for the parameter \(t\text{.}\)
Here is a list of playground functionality
Subsection 5.12.1 Tracing the Curve
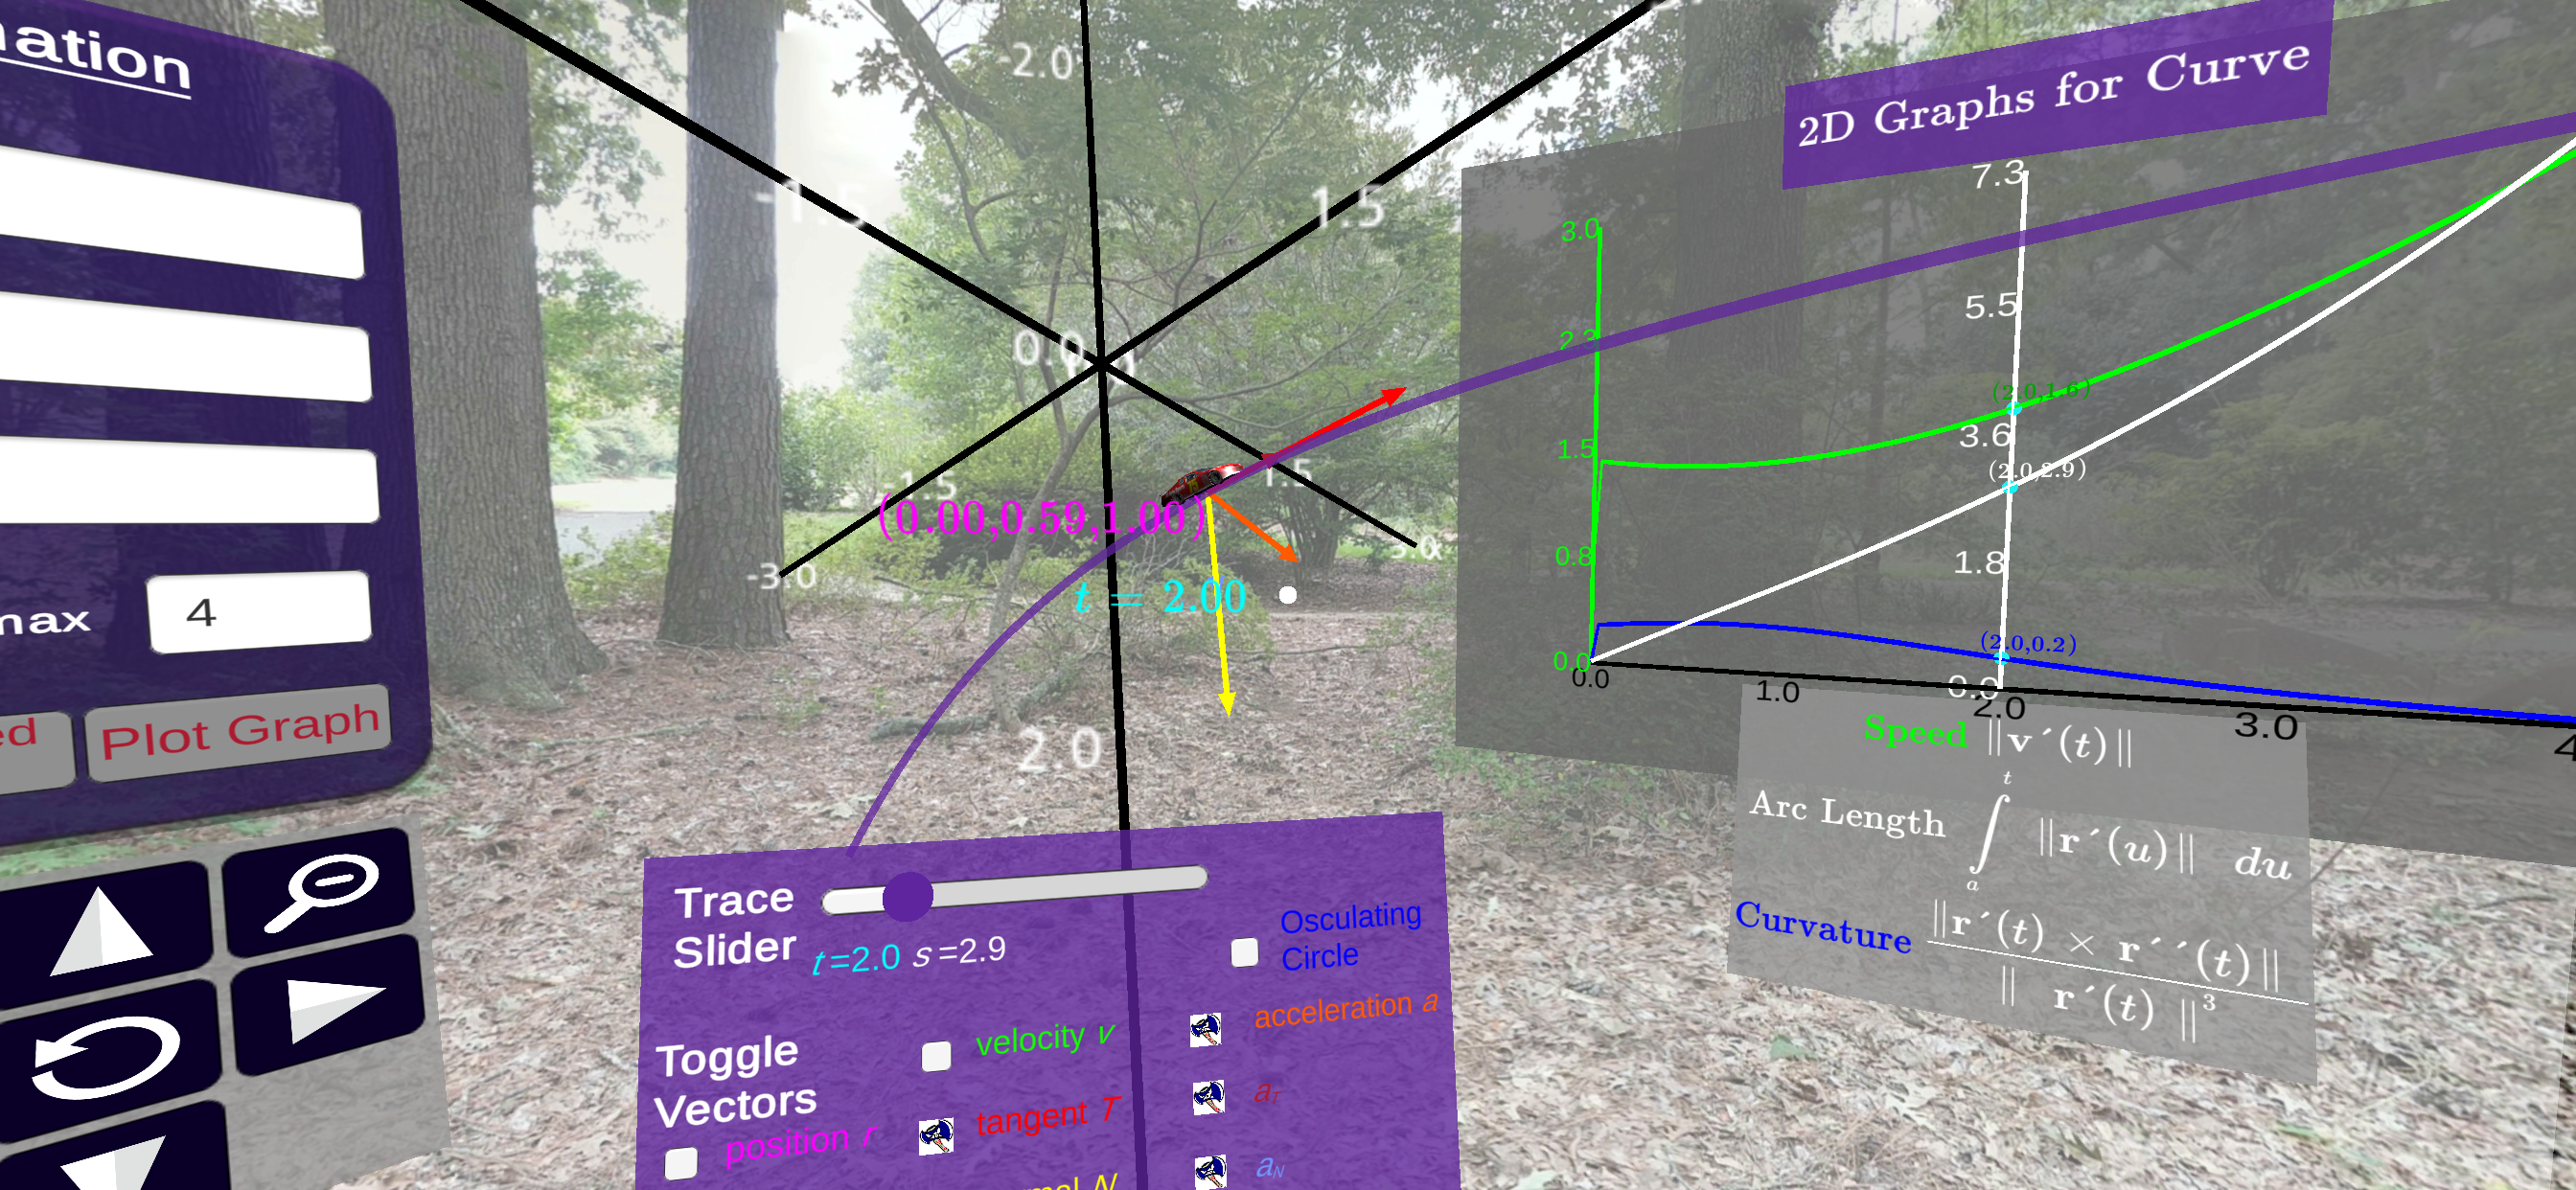
One of the best ways to study the parametric curve being displayed is by using the slider located directly below the curve. Moving the slider changes the parameter \(t\) used to define the equations of the curve. This also moves the point on the curve and the vectors displaying characteristics of the curve. You may also notice that below the slider you will see the parameter \(s\text{.}\) The parameter \(s\) is an approximation to the arc length parameter studied in calculus.
As you adjust the slider, a point on the 2d graphs representing the arc length, curvature, and speed will also be moved. The approximate value of these quantities are displayed near the point on the 2d graphs.
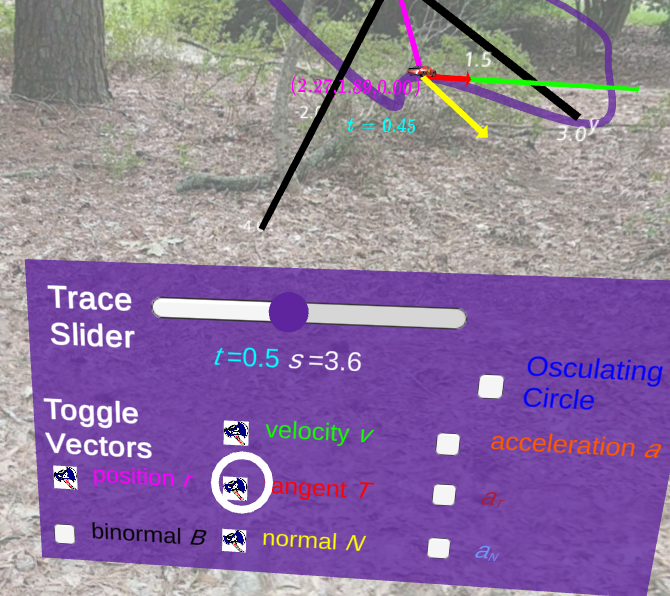
Subsection 5.12.2 Displaying Vectors
For the displayed parametric curve, several descriptive vectors are displayed at the point controlled by the slider detailed in Subsection 5.12.1. The vectors displayed match their color on the panel pictured below. Each vector can be turned on or off to concentrate on particular aspects of the parametric curve. This is accomplished by "clicking" the checkbox next to the vector on the panel.
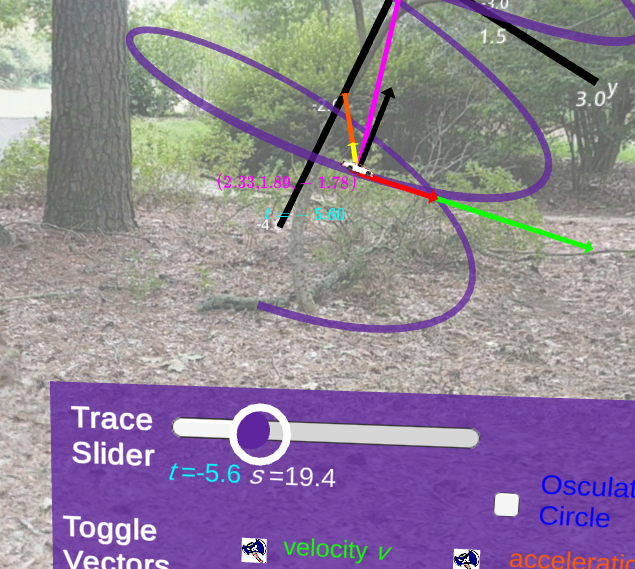
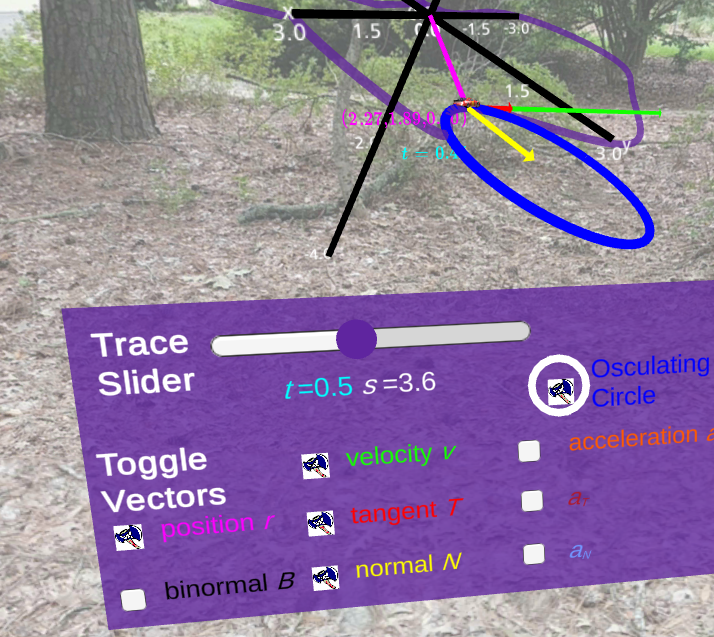
Subsection 5.12.3 Displaying Osculating Circle
Similar to the vector controls described in Subsection 5.12.2, an osculating circle can be turned on or off using the panel below the graph. This circle can be used to study the curvature and radius of curvature for a parametric equation.
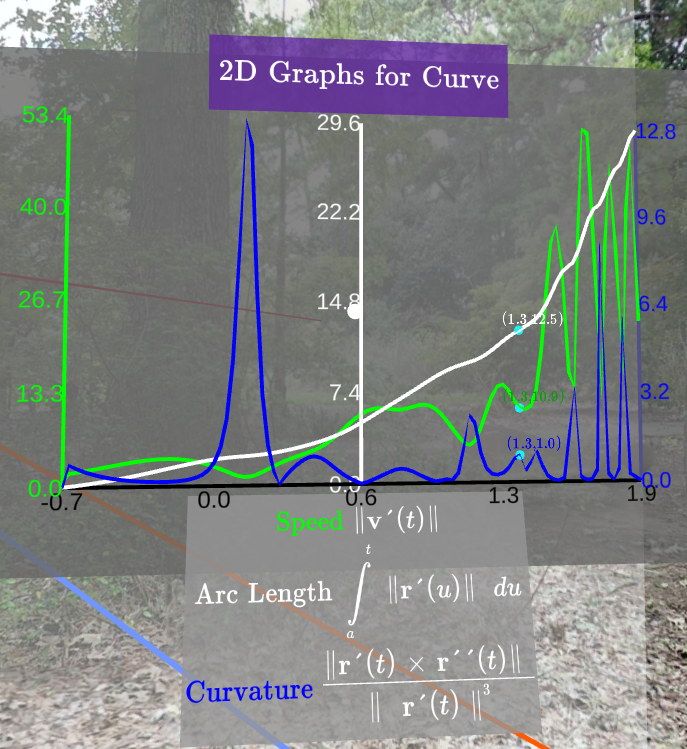
Subsection 5.12.4 Tracing and Viewing Speed, Curvature, and Arc Length Graphs
As mentioned in Subsection 5.12.1, for each curve approximations to the speed, curvature, and arc length curve are displayed to the right. A point on these graphs can be moved using the trace slider on the panel below the parametric curve.
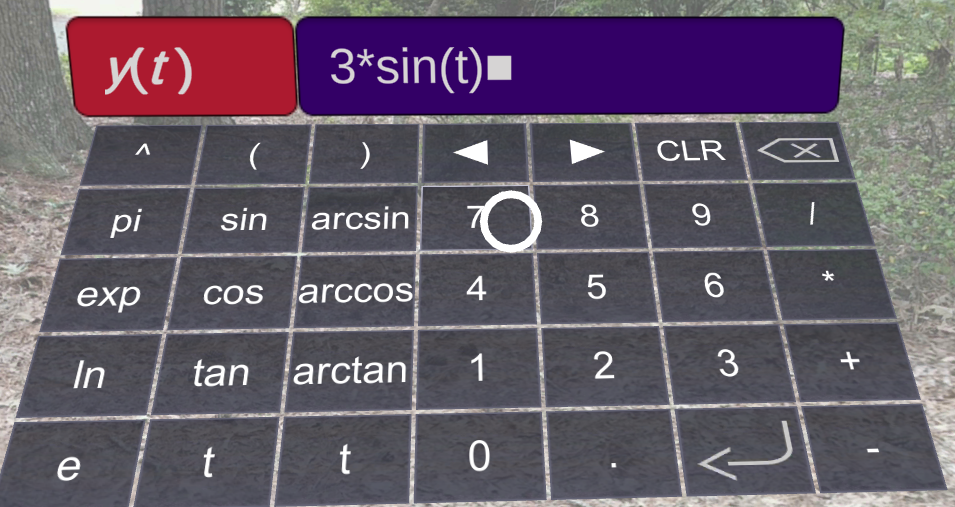
Subsection 5.12.5 Entering Functions
The panel to the left is used to enter equations for parametric curves. When you “click” or “select” one of the textboxes, a keyboard will display. This keyboard can be used to enter the equation of your choice. Once you select Enter on the keyboard, the textbox will have the equation you entered. On the panel clicking or selecting Plot Graph constructs the parametric curve.
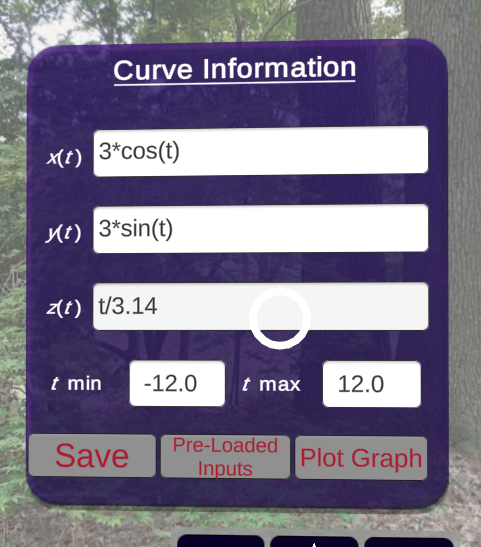
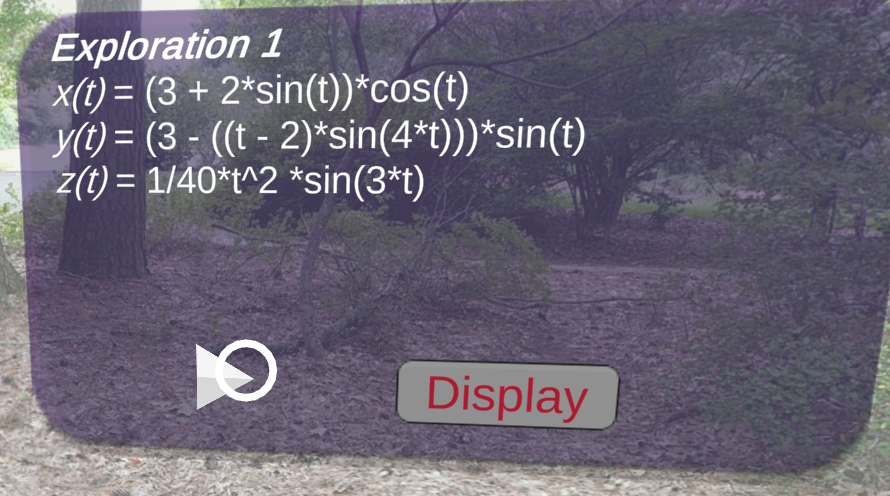
Subsection 5.12.6 Loading and Saving Parametric Equations
For any set of equations for a parametric curve, the equations can be saved for later viewing. This is accomplished by selecting Save button on the panel pictured below. You can load the equations you saved (and some equations that are pre-saved) by using the Pre-Loaded Inputs button. Use the arrows to select the equations of choice and click on Display to show the parametric curve described by the equations.