Explore the relationship between tangent planes and local extrema.
Examine the geometric intuition behind the second derivative test.
Understand how to use contour plots to help us identify local extrema and saddle points.
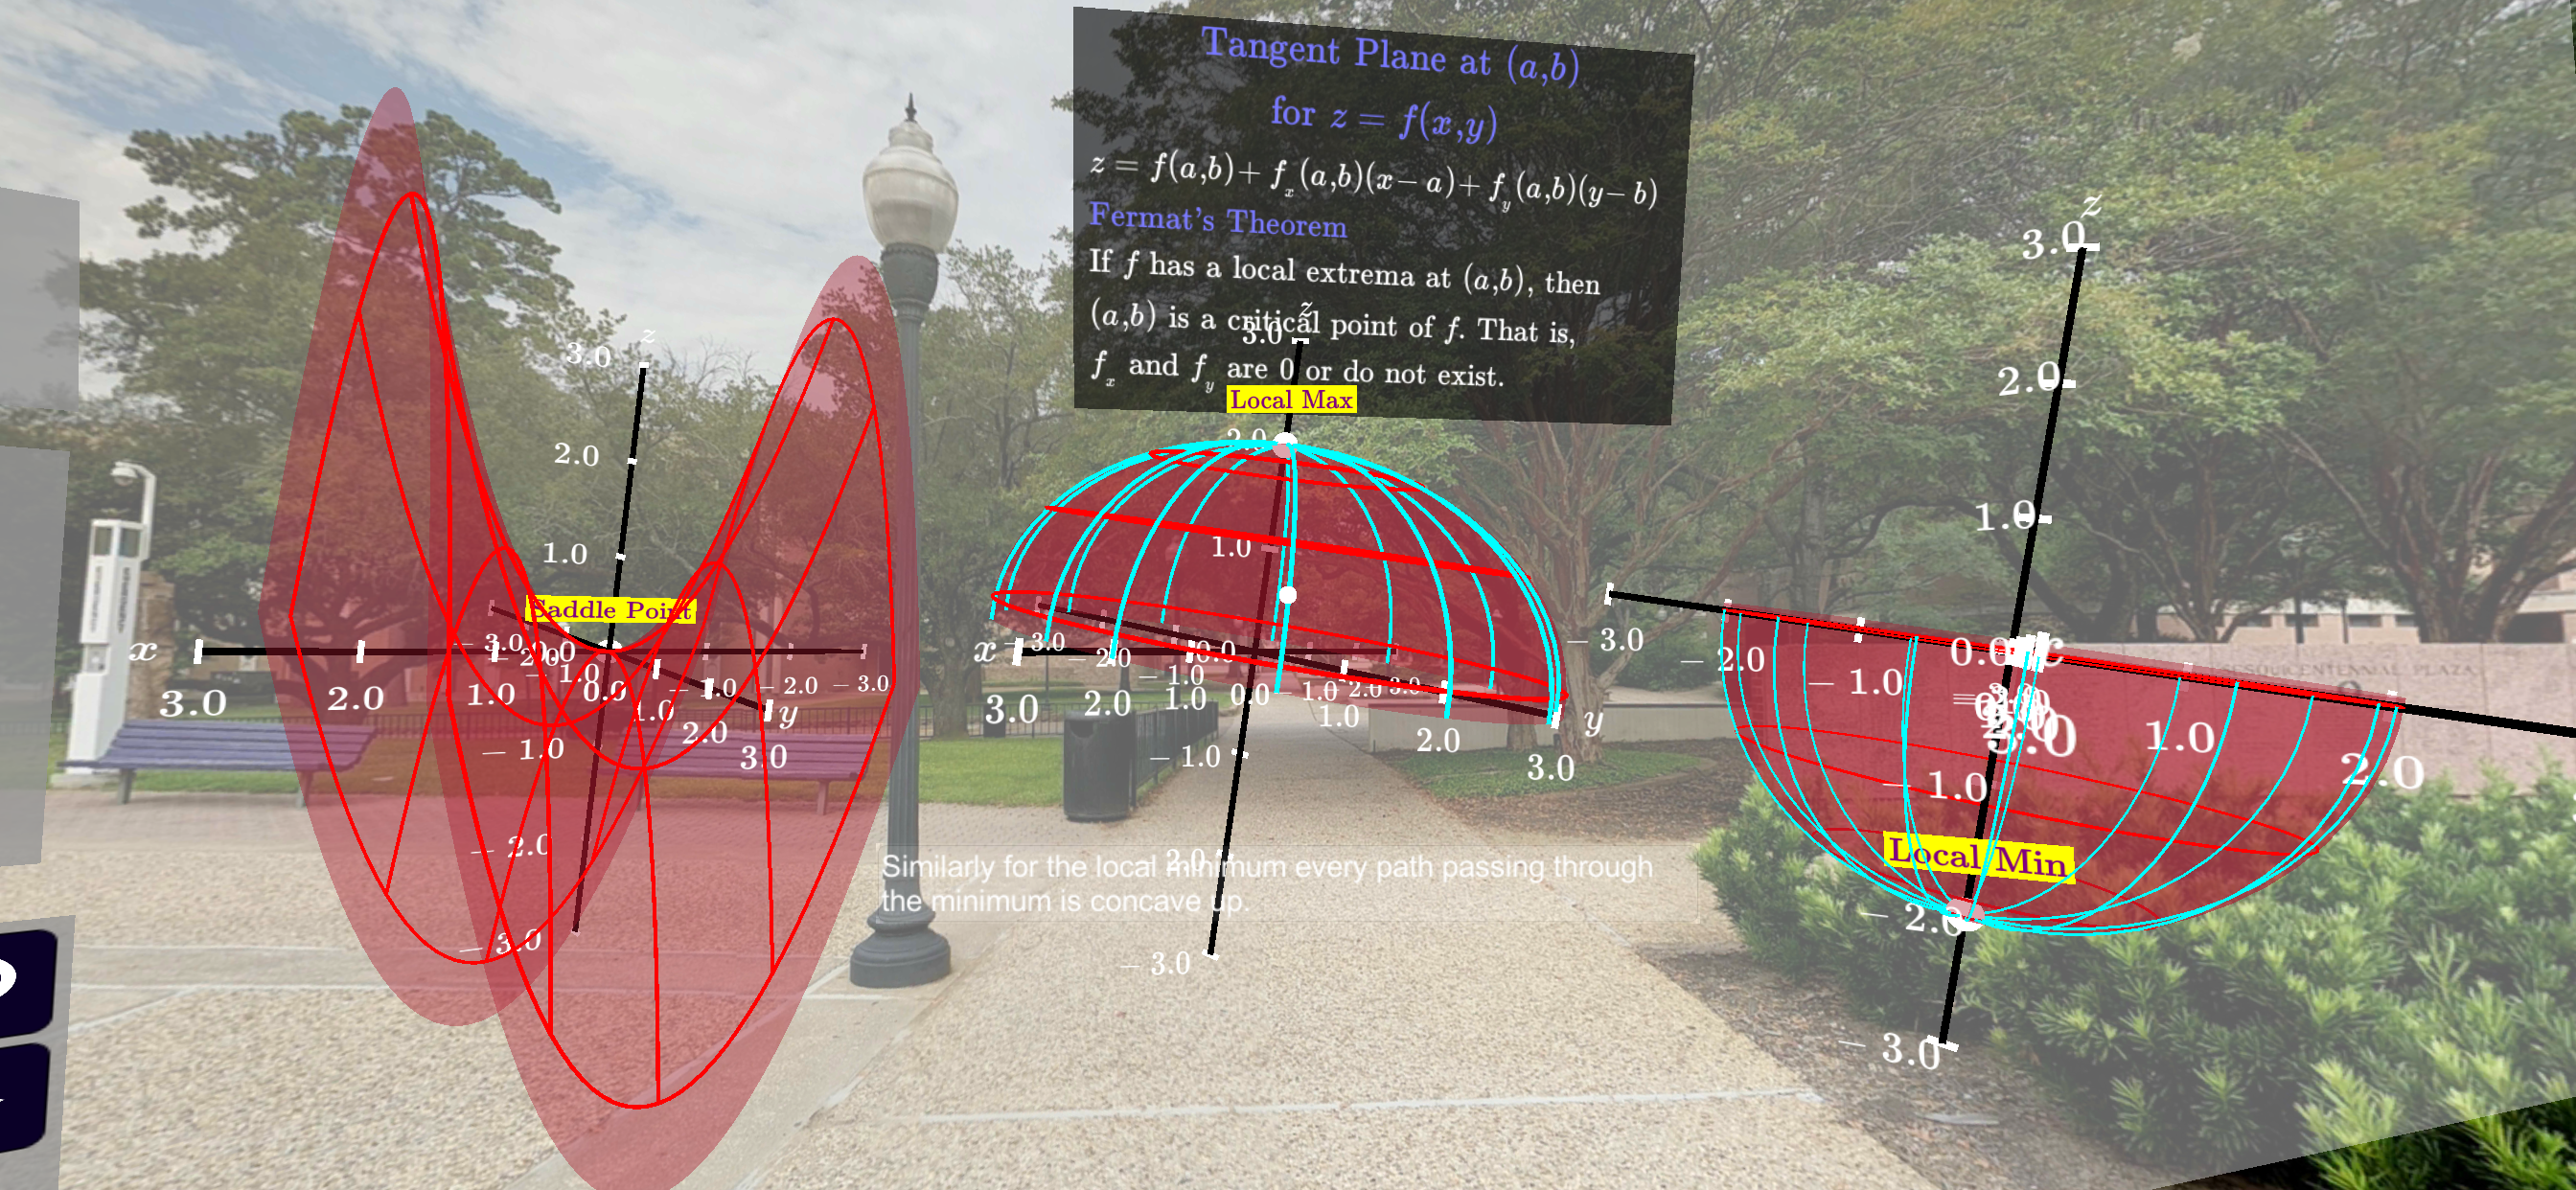
Figure6.10.1.A screenshot from the lesson on local extrema of multivariable functions.
This lesson examines how to find relative maximums and minimums for functions of two or more variables. In particular, several examples are shown where horizontal tangent planes (tangent planes with no change in x or y) correspond to relative extrema. Additionally, points with horizontal tangent planes that do not correspond to relative extrema are demonstrated with saddle surfaces. The process of finding candidate points for optimization is motivated by finding where the gradient function is the zero vector. Further, the second partials test is described in terms of measuring whether a function has the same concavity in every direction at a point (with a horizontal tangent plane). Examples of surfaces with multiple relative extrema and saddle points are presented along with the algebraic calculations used to verify the second partials test.
Subsection6.10.1Identifying Extrema Using Contour Plots
Much of the time the identification of local extrema is an algebraic process. This is typically accomplished by finding critical values and applying the second derivative test. When our algebraic techniques fail, we have to pursue other avenues. One such avenue involves examining contour plots. While this is not as rigorous as the second derivative test, under typical cases, the contour plot can provide information about behavior near critical values.
Activity6.10.1.
Several images of contour plots are presented below with critical points marked in red. For each critical point use the information presented in the contour plot to determine if the critical point is a local minimum, local maximum, or saddle point.